
Over the last couple of months, we have seen a sharp recovery in asset prices, and stocks have rebounded to near their February highs. In contrast, the situation in the real economy is still pretty dreadful. First-quarter GDP in the US fell at an annualized 5.0% rate, and is projected to fall almost 50% annualized in the second quarter! Unemployment has surged dramatically from record lows to record highs in just a couple of months. To top it off, we have also seen mass social unrest in 350 cities in the US and across major cities around the world. But financial assets have simply shrugged off all the bad news.
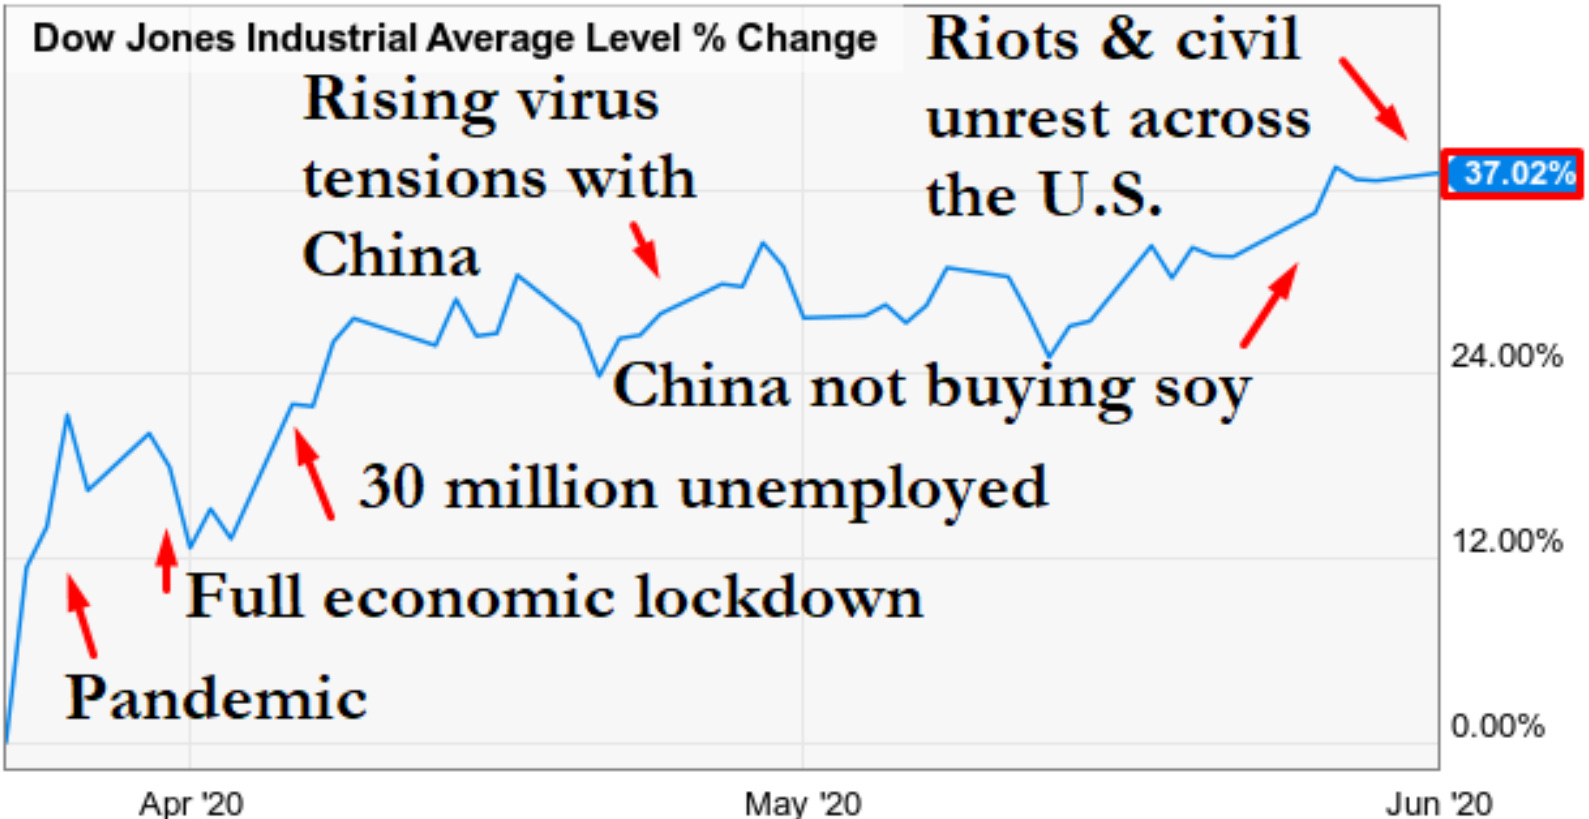
So, why the dichotomy between the financial markets and the real economy? Well, first of all, economics is not a hard science like physics, and there is no Law of Returns that says that stock returns must be closely tethered to the real economy. Indeed, stock returns are driven by demand & supply as well as fear & greed cycles. To wit: the 2009 to 2020 economic recovery was the weakest since the Great Depression of the 1930s, with real GDP growth averaging just a little over 2% a year. However, in that span, we saw the S&P 500 rise five-fold from a low of 666 in March 2009 to an all-time high of 3386 in February 2020.
So, with that out of the way, what’s behind the surge in stocks?
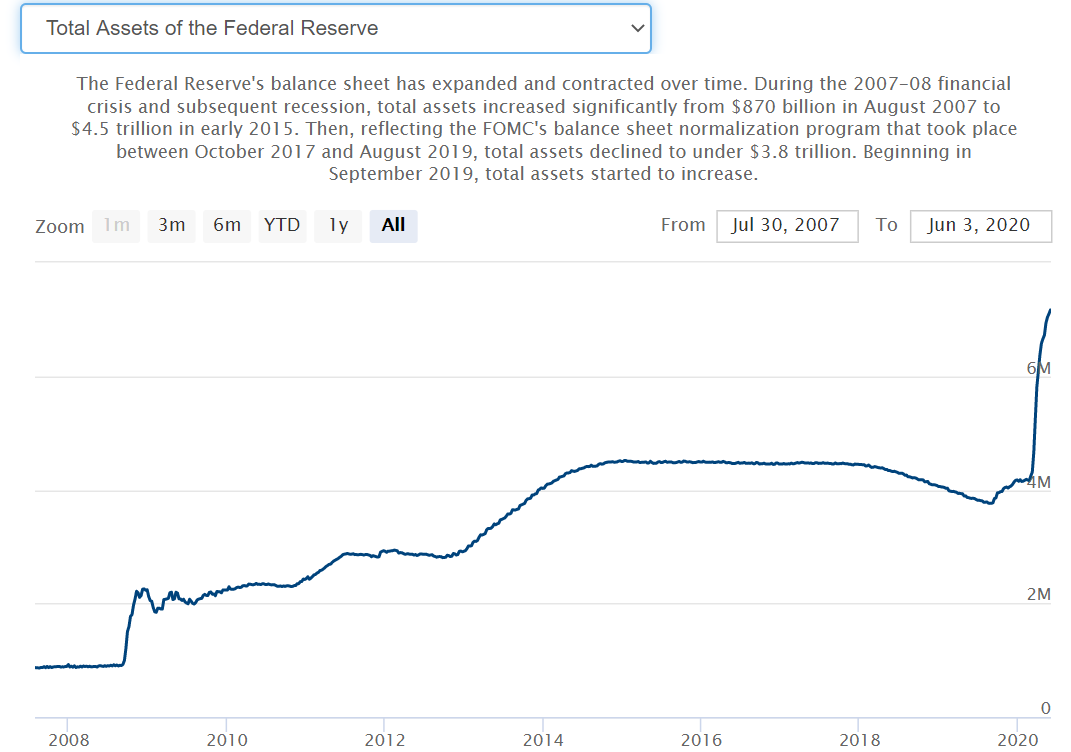
Clearly, a big driver is the massive fiscal and monetary response we have seen. As they say, Don’t Fight The Fed. Or, to be facetious (but still accurate), Money Printer Go Brrr. Compared to the Global Financial Crisis (GFC) of 2007-09, central bank and government actions this time around have been truly unprecedented in both their speed and their size.
The US Federal Reserve increased its balance sheet from $870bn in 2007 to $4.5tn in 2015. By comparison, just in the short period since mid-March 2020, the Fed’s balance sheet has expanded from $4.2tn to $7.2tn! The Fed has unleashed around $3tn in lending for markets, state and local governments, corporates, and households. We could see its balance sheet rise to $10tn in 2020 alone.
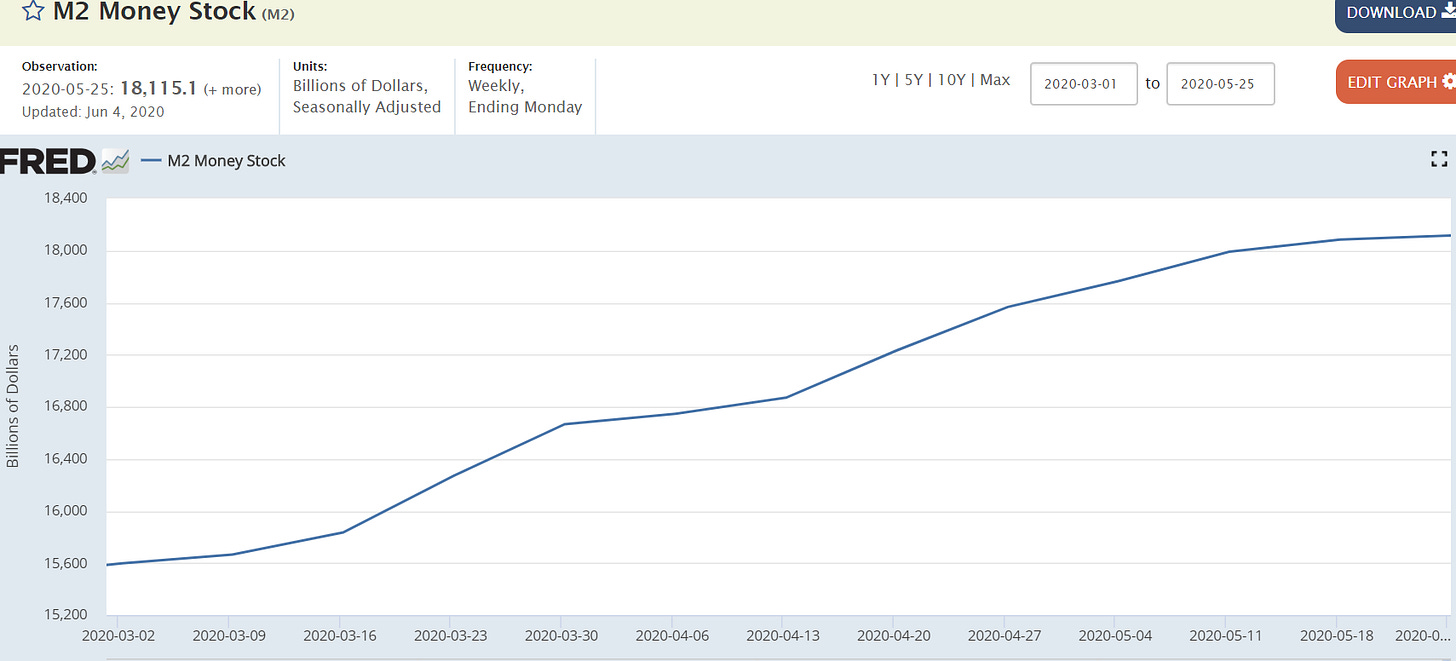
This rise in liquidity can also be seen in the surge in M2 Money Supply (includes cash, checking, savings deposits, certificates of deposit, and money-market funds), which is up 22% annualized in the last 3 months. This is the rocket fuel that has been pouring into stocks and other assets.
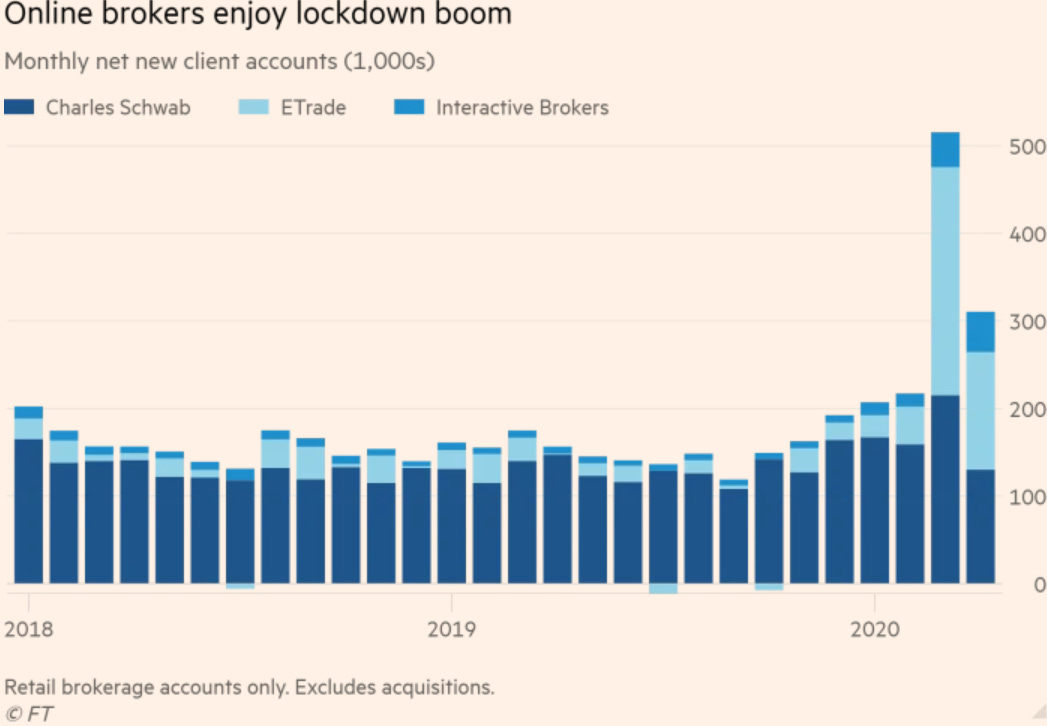
Over the last few months, we have also seen a distinct rise in speculative fervor and frenzied trading as evidenced by the surge in new trading accounts, driven by the lockdown and zero trading charges. A CNBC article from just today reports on young, homebound traders spending their government stimulus checks on trading on millennial trading platforms like Robinhood. The FT reports that three top online US brokerages have seen almost 800,000 sign-ups in March and April as the shutdown in professional sports has moved frustrated sports gamblers to the stock market.


In addition, the strict lockdowns globally have successfully flattened the infection trajectory, and the recent re-opening of economies both globally and in the US has been smoother than expected. While there has been a noticeable uptick in some places, we haven't seen a dangerous surge in new Covid-19 cases and fatalities as yet.
Economic data has also improved recently at the margin (from incredibly bad to slightly less bad), especially in the US. Consumer spending has also proven to be fairly resilient, as evidenced by a 10.5% rise in US personal incomes in April, improving May auto sales, and 8 weeks of higher home mortgage applications. The May US payroll report was a shocker, showing that the economy actually added 2.5 million jobs compared to expectations of 8 million job losses, and the unemployment rate fell to 13.3%.
Hopefully, this has shed some light on some of the reasons behind the breathtaking surge in asset prices. I plan to publish another piece on the risks to this rally and how much staying power I think it has. Stay tuned.
Mack Row
Sign up so you don’t miss future issues, and tell your friends